Transportation Network Robustness
A Percolation Modeling Approach
Shangjia Dong, dongs@oregonstate.edu, Oregon State University
Background
Unplanned disruption in the transportation system would lead to severe consequences. In particular, earthquake often results in immediate life and economic losses. For example, 1994 Northridge, US earthquake resulted $20 billion loss; in 1995 Kobe, Japan earthquake, more than 35,000 fatalities and the total economic loss is amount to $120 billion etc. Transportation disruption is found very common in the earthquake due to landslide (debris block) and liquefaction (damage to road pavement and bridge damage).
Understanding the robustness of network against such component failures is closely related to the study of percolation on networks. Percolation is normally parametrized by a probability, which stands for the probability that a node is present or functioning in the network. As the probability decreases, there comes a point where the giant component breaks apart and only small components are left. Thus the presence of a giant component can serve as an indicator of a network that is at least partially functioning, and the size of the giant component reflects the proportion of the network that is working. In this project, we focused on exploring the robustness of the road network from its topology perspective at different scales.
 source
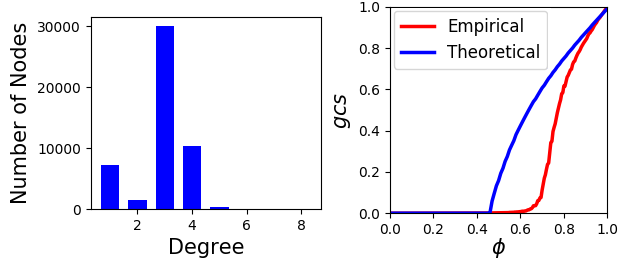
Boston
Boston Transportation Network Robustness Index: 0.21 .
| Degree | Number of Nodes |
|---|---|
| 1 | 7905 |
| 2 | 1622 |
| 3 | 30315 |
| 4 | 10385 |
| 5 | 365 |
| 6 | 49 |
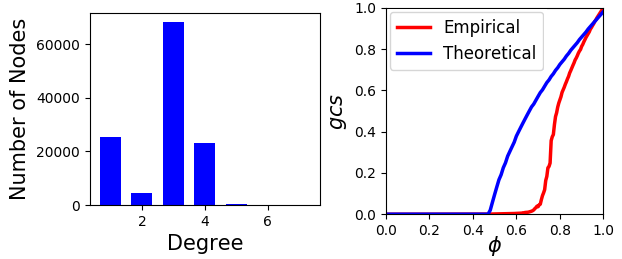
Las Vegas
Las Vegas Transportation Network Robustness Index: 0.19.
| Degree | Number of Nodes |
|---|---|
| 1 | 26040 |
| 2 | 4672 |
| 3 | 68855 |
| 4 | 23368 |
| 5 | 369 |
| 6 | 41 |
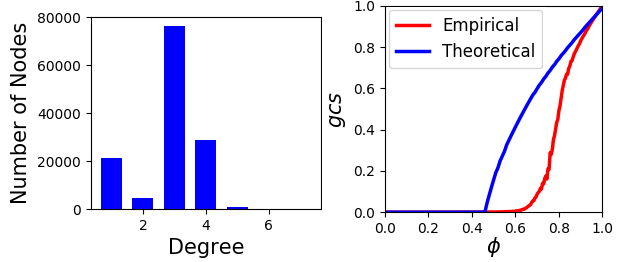
San Francisco
San Francisco Transportation Network Robustness Index: 0.19.
| Degree | Number of Nodes |
|---|---|
| 1 | 22323 |
| 2 | 4924 |
| 3 | 76590 |
| 4 | 28724 |
| 5 | 978 |
| 6 | 74 |
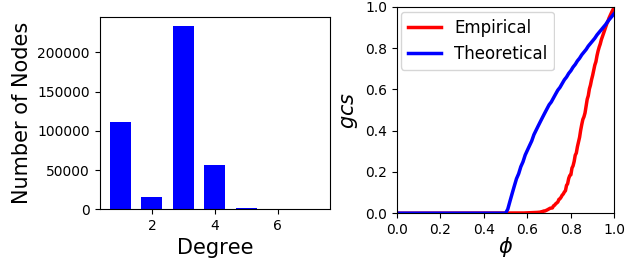
Seattle
Seattle Transportation Network Robustness Index: 0.14.
| Degree | Number of Nodes |
|---|---|
| 1 | 121881 |
| 2 | 17194 |
| 3 | 253486 |
| 4 | 59733 |
| 5 | 1061 |
| 6 | 98 |
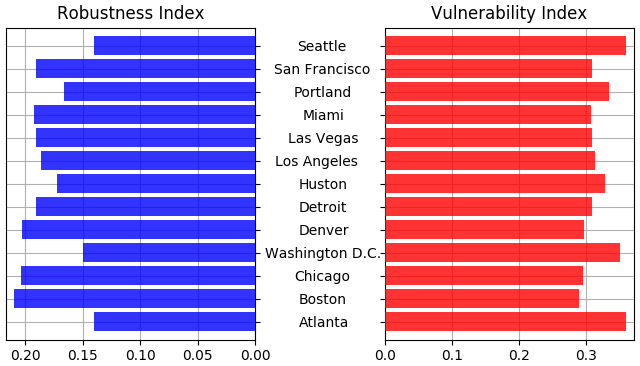
Summary
The robustness rank of different cities.